U.S. Traffic Congestion Surges to Record Highs in 2024
Traffic conditions across major U.S. metropolitan areas have intensified during 2024, with congestion expanding into hours that previously saw lighter traffic and reaching levels higher than before the pandemic. Cities along both coasts and in growing inland regions are now experiencing heavier delays throughout the week, reflecting broader economic activity, population growth and shifting work habits. In places like San Diego, Los Angeles and Miami, drivers report facing longer backups not only during traditional peak periods but increasingly during mid-day, evenings and weekends, a trend that transportation researchers confirm is reshaping urban mobility nationwide.
Commuters across the country are now spending an average of 63 hours per year in congestion, a measurable rise compared to recent years. As delays intensify, local governments and transportation agencies are reevaluating roadway strategies, traffic-management systems and long-term planning models to address the changing patterns. The spread of remote work, fluctuations in daily travel and increases in commercial vehicle activity are influencing when and where congestion forms. These evolving patterns are also contributing to new policy discussions about the future of highways, transit infrastructure and regional mobility planning.
Delays Spread Beyond Rush Hour as Travel Patterns Shift
One of the most notable developments in 2024 is the expansion of traffic delays across more hours of the day. While traditional morning and evening rush hours still account for the highest volumes, mid-day travel windows that were once relatively smooth now face unanticipated backups. This adjustment reflects a broader reshaping of commute schedules, as hybrid work models and flexible office hours change how people move around cities. In addition, weekend travel is experiencing a clear uptick in delays, with Saturdays and Sundays showing more congestion linked to leisure activities, local events and retail traffic.
Researchers note that Thursday is catching up to Friday as one of the busiest days of the week, while Mondays remain noticeably lighter. This uneven distribution adds unpredictability for drivers and complicates efforts by transportation departments to deploy consistent traffic-management strategies. Meanwhile, the growing presence of commercial trucks on major corridors—especially those connected to online retail and regional logistics—has added pressure to corridors that were once less crowded during off-peak hours. More freight vehicles are now operating during traditional commute times, contributing to traffic volumes typically seen only during high-demand periods.
Major Cities Feel the Impact as Delays Rise Nationwide
Several metropolitan areas have experienced significant increases in congestion intensity. San Diego recorded one of the most notable spikes, with more than a 37% jump in delay hours per commuter since 2019. Miami, Phoenix and the San Francisco Bay Area have also seen substantial rises, reflecting economic expansion, population growth and strong local job markets. However, Greater Los Angeles remains the most congested region in the country, where commuters lost an average of 137 hours to traffic delays in 2024.
Experts emphasize that congestion often mirrors broader economic health, with thriving regions typically seeing heavier demand on road systems. As urban economies expand and more people resume in-person activities, the strain on infrastructure continues to grow. Some regions, however, provide exceptions. Washington, D.C., for example, has seen congestion remain below pre-pandemic levels, due in part to persistent remote-work practices within federal agencies. This divergence underscores how workplace flexibility continues to influence mobility trends.
To better understand how infrastructure affects economic growth, readers can explore state-level development data through resources such as the U.S. Department of Transportation (https://www.transportation.gov) and regional updates available from USA.gov (https://www.usa.gov). Those interested in demographic and commuting statistics can review national data from the Census Bureau (https://www.census.gov) and explore energy-related transportation trends in reports from the U.S. Energy Information Administration (https://www.eia.gov).
Cities Explore Pricing Strategies and New Tools to Reduce Congestion
In response to worsening delays, several regions are implementing dynamic tolling strategies and congestion-pricing systems to manage roadway demand. Northern Virginia’s extensive network of variable toll lanes adjusts pricing based on real-time traffic conditions, encouraging drivers to modify travel times or choose alternative routes. Early results suggest reductions in peak-hour backups along major corridors, prompting other metropolitan areas to evaluate similar approaches.
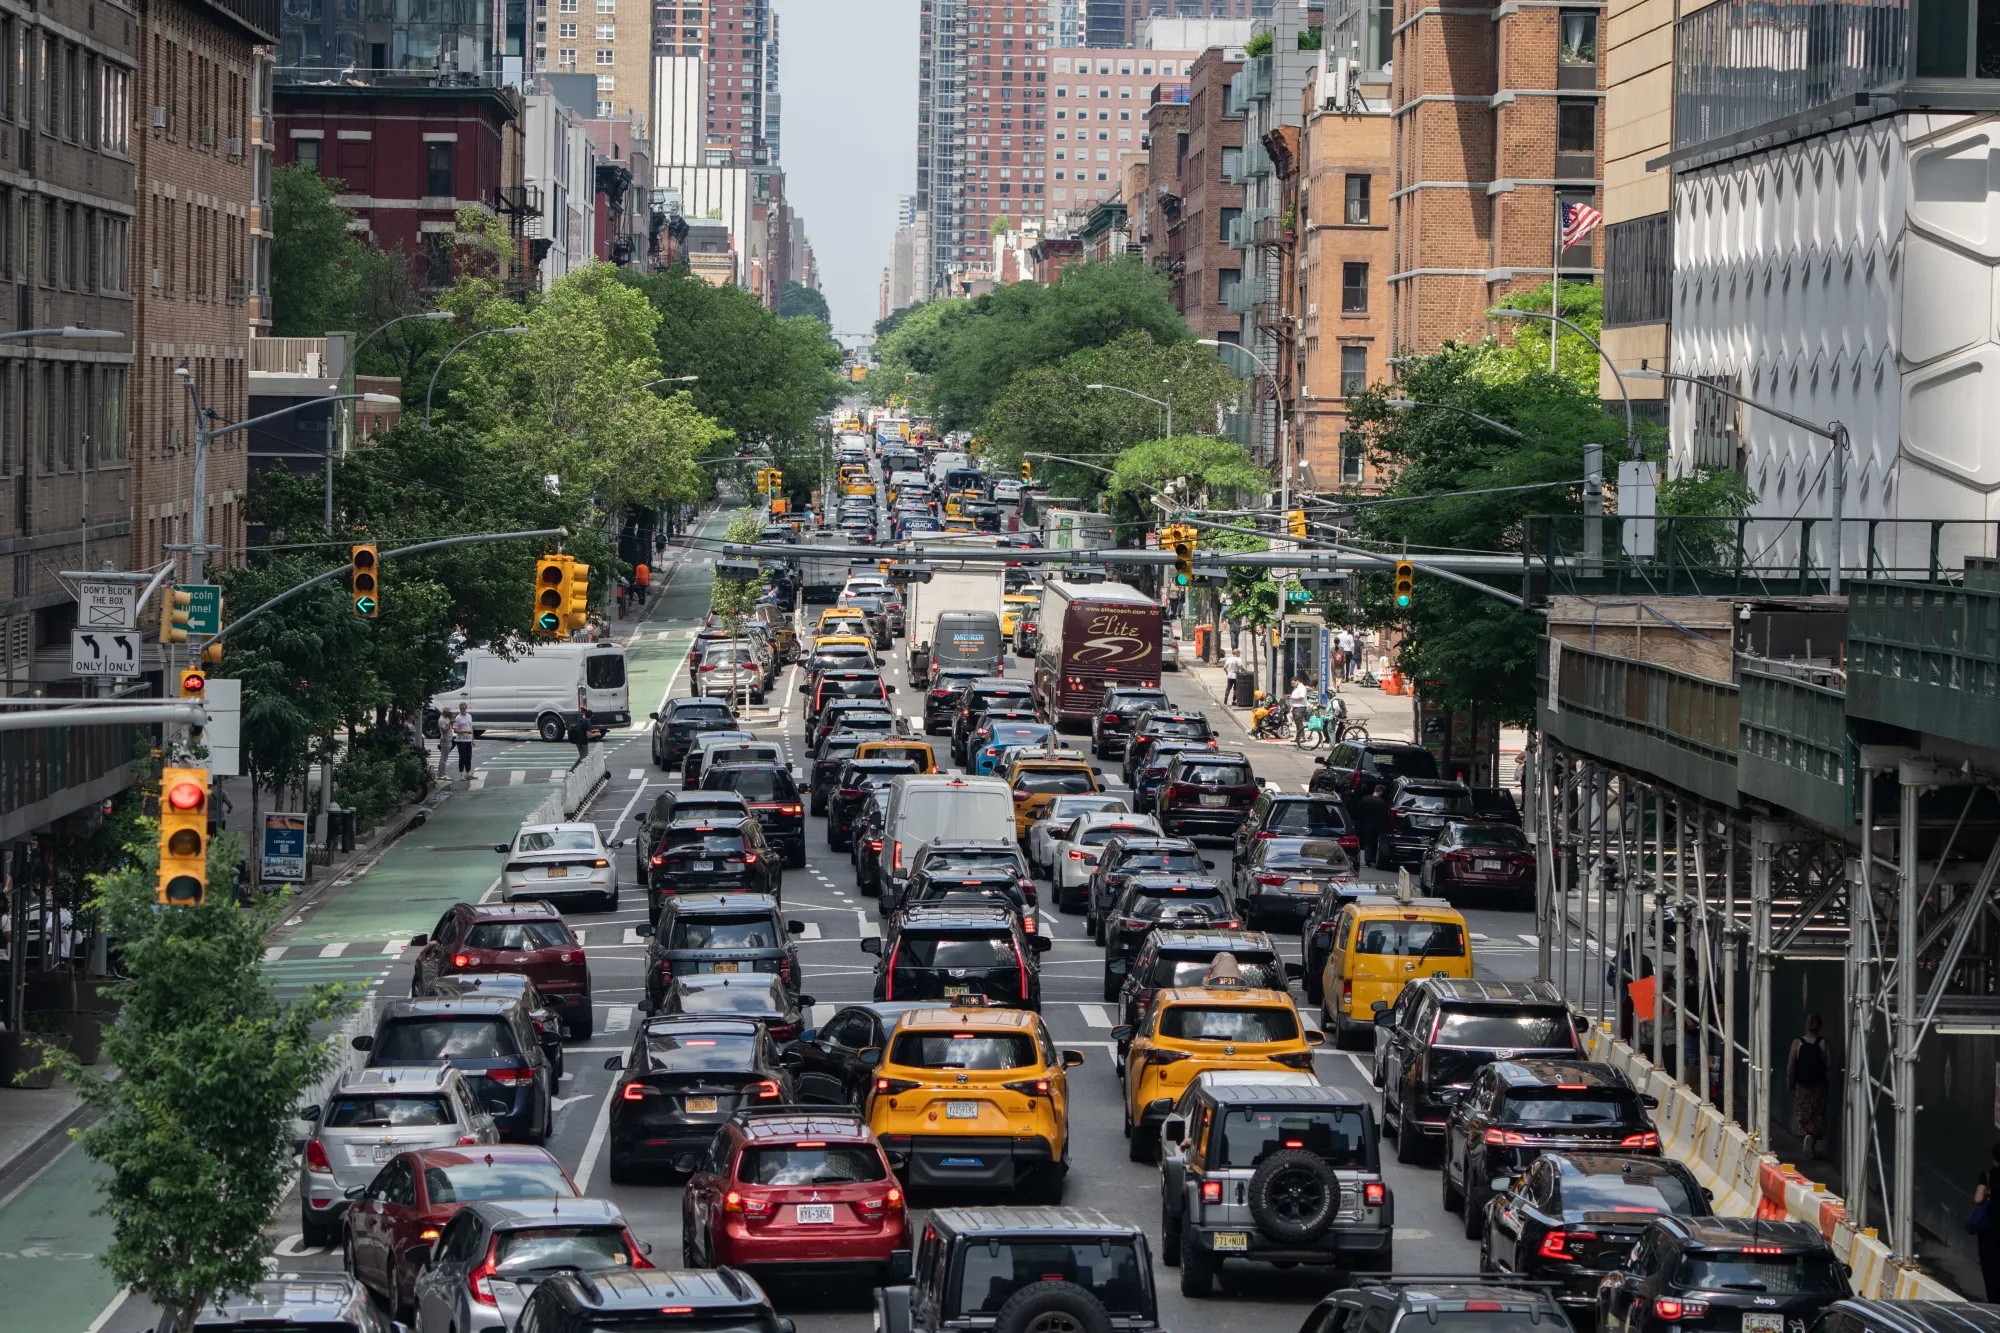
New York City has launched a congestion-pricing program requiring drivers to pay up to $9 to enter Lower Manhattan. The initiative has already reduced traffic within the toll zone and aims to support long-term improvements in public transit and urban mobility infrastructure. Although its full regional impact is still being analyzed, it represents one of the most ambitious congestion-reduction strategies enacted in the United States.
As cities examine new technologies, transportation planners underscore that the combination of behavioral changes, roadway innovation, dynamic pricing and long-term infrastructure investment will shape urban mobility for years to come. From freight optimization to advanced traffic-signal coordination, metropolitan regions are exploring multiple tools to manage increasing demand on their transportation systems.